Updated August 31, 2017 (PDFs now available, links to file below image)
Download Instructions: Click on the image you want to download. Once the image is open right click on it and select “save as”. Save it to your computer. Use the photo viewer on your computer to zoom in and out of the maps.
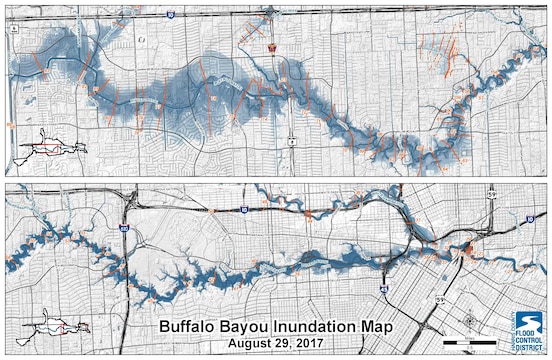
Buffalo Bayou Inundation Map
(New - Loaded August 30, 2017)
Download PDF
The illustrations depict modeling from what we projected early Aug. 29 before we increased our releases to 7000 and 6000 at Addicks and Barker Dams. Areas depicted in green are currently not flooded, as previously predicted due to the increased releases. (Photo by USACE Galveston)
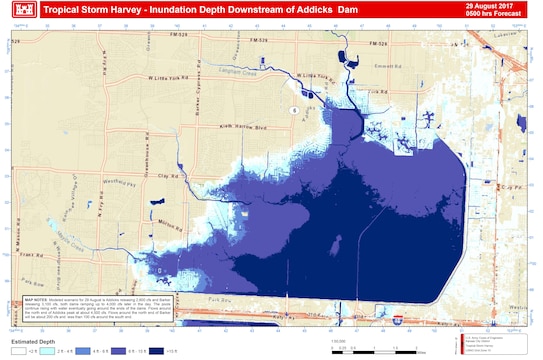
Inundation Depth Downstream of Addicks Dam
Download PDF
The illustrations depict modeling from what we projected early Aug. 29 before we increased our releases to 7000 and 6000 at Addicks and Barker Dams. Areas depicted in green are currently not flooded, as previously predicted due to the increased releases. (Photo by USACE Galveston)
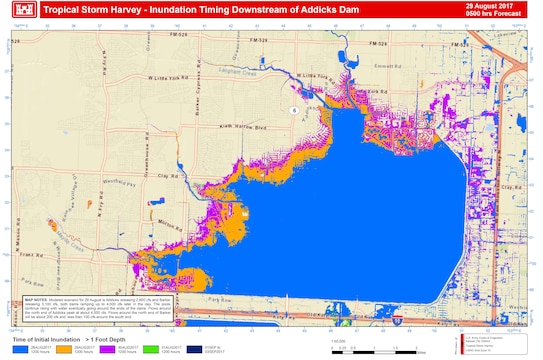
Inundation Timing Downstream of Addicks Dam
Download PDF
The illustrations depict modeling from what we projected early Aug. 29 before we increased our releases to 7000 and 6000 at Addicks and Barker Dams. Areas depicted in green are currently not flooded, as previously predicted due to the increased releases.
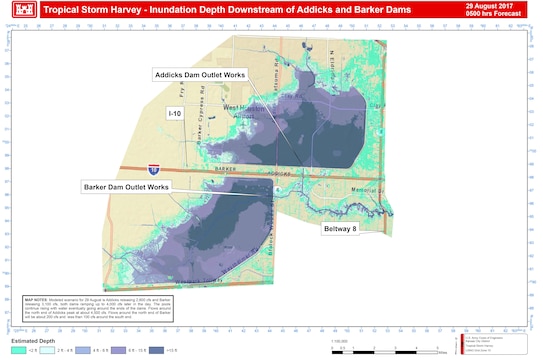
Inundation Depth Downstream of Addicks and Barker Dams
Download PDF
The illustrations depict modeling from what we projected early Aug. 29 before we increased our releases to 7000 and 6000 at Addicks and Barker Dams. Areas depicted in green are currently not flooded, as previously predicted due to the increased releases. (Photo by USACE Galveston)
Download Instructions: Click on the image you want to download. Once the image is open right click on it and select “save as”. Save it to your computer. Use the photo viewer on your computer to zoom in and out of the maps.
Buffalo Bayou Inundation Map
(New - Loaded August 30, 2017)
Download PDF
The illustrations depict modeling from what we projected early Aug. 29 before we increased our releases to 7000 and 6000 at Addicks and Barker Dams. Areas depicted in green are currently not flooded, as previously predicted due to the increased releases. (Photo by USACE Galveston)
Inundation Depth Downstream of Addicks Dam
Download PDF
The illustrations depict modeling from what we projected early Aug. 29 before we increased our releases to 7000 and 6000 at Addicks and Barker Dams. Areas depicted in green are currently not flooded, as previously predicted due to the increased releases. (Photo by USACE Galveston)
Inundation Timing Downstream of Addicks Dam
Download PDF
The illustrations depict modeling from what we projected early Aug. 29 before we increased our releases to 7000 and 6000 at Addicks and Barker Dams. Areas depicted in green are currently not flooded, as previously predicted due to the increased releases.
Inundation Depth Downstream of Addicks and Barker Dams
Download PDF
The illustrations depict modeling from what we projected early Aug. 29 before we increased our releases to 7000 and 6000 at Addicks and Barker Dams. Areas depicted in green are currently not flooded, as previously predicted due to the increased releases. (Photo by USACE Galveston)